Lincoln Electric RealWeld handleiding
Handleiding
Je bekijkt pagina 37 van 52
B-21
OPERATION (TRAINEE MODE)REALWELD
®
TRAINER
In Arc On mode, ‘Start’ and ‘Stop’ icons are disabled. When the
trainee is ready to weld, they can just start welding. The program
will automatically start recording data once an arc is struck and it will
save that data once stopped. Make sure the gages are not red prior
to or during Arc On welding. If the trainee is leaning over the torch
and happens to cover the target, the gages will turn red and data will
not be saved.
Once the trainee has stopped welding, results will be shown in
Analysis mode.
ANALYSIS
When the ‘Stop’ icon is selected in Arc Off mode or welding is
stopped in Arc On mode, the program will enter Analysis Mode, as
indicated by the light blue color next to the ‘Analysis’ icon. The gages
will freeze and will display a variety of numerical values.
Directly next to the white gages, there are several percentage value
gages for each torch motion. The percentage value displayed after
the test is the amount of time that the trainee kept that motion in
the sweet spot. For example, if the travel speed gauge says 25%,
that means that for 25% of the time during the test, the trainee was
able to maintain a Travel Speed that was within the sweet spot. See
Figure B.85.
The score, which is displayed as a number and a bar graph, is a
calculated value based on the amount of time that all five torch
motions are within the sweet spot at the same time.
For example, let’s assume the following:
Work Angle, Travel Angle, CTWD are all within the sweet spot for the
entire weld (100%). Travel Speed was in the sweet spot during the
1st half of the weld, but not the second half (50%). The Proximity
was not in the sweet spot during the 1st half of the weld, but was in
the second half (50%). In this scenario, the resulting score would be
0 (zero). All five torch motions were not in the sweet spot at the same
time.
For another example, let’s assume the following:
Work Angle, Travel Angle, CTWD and Travel Speed are in the sweet
spot 100% of the time. However, Proximity is within the sweet spot
12% of the time. In this scenario, the resulting score would be 12%
since all five torch motions were operating within the sweet spot at
the same time for only 12% of the time.
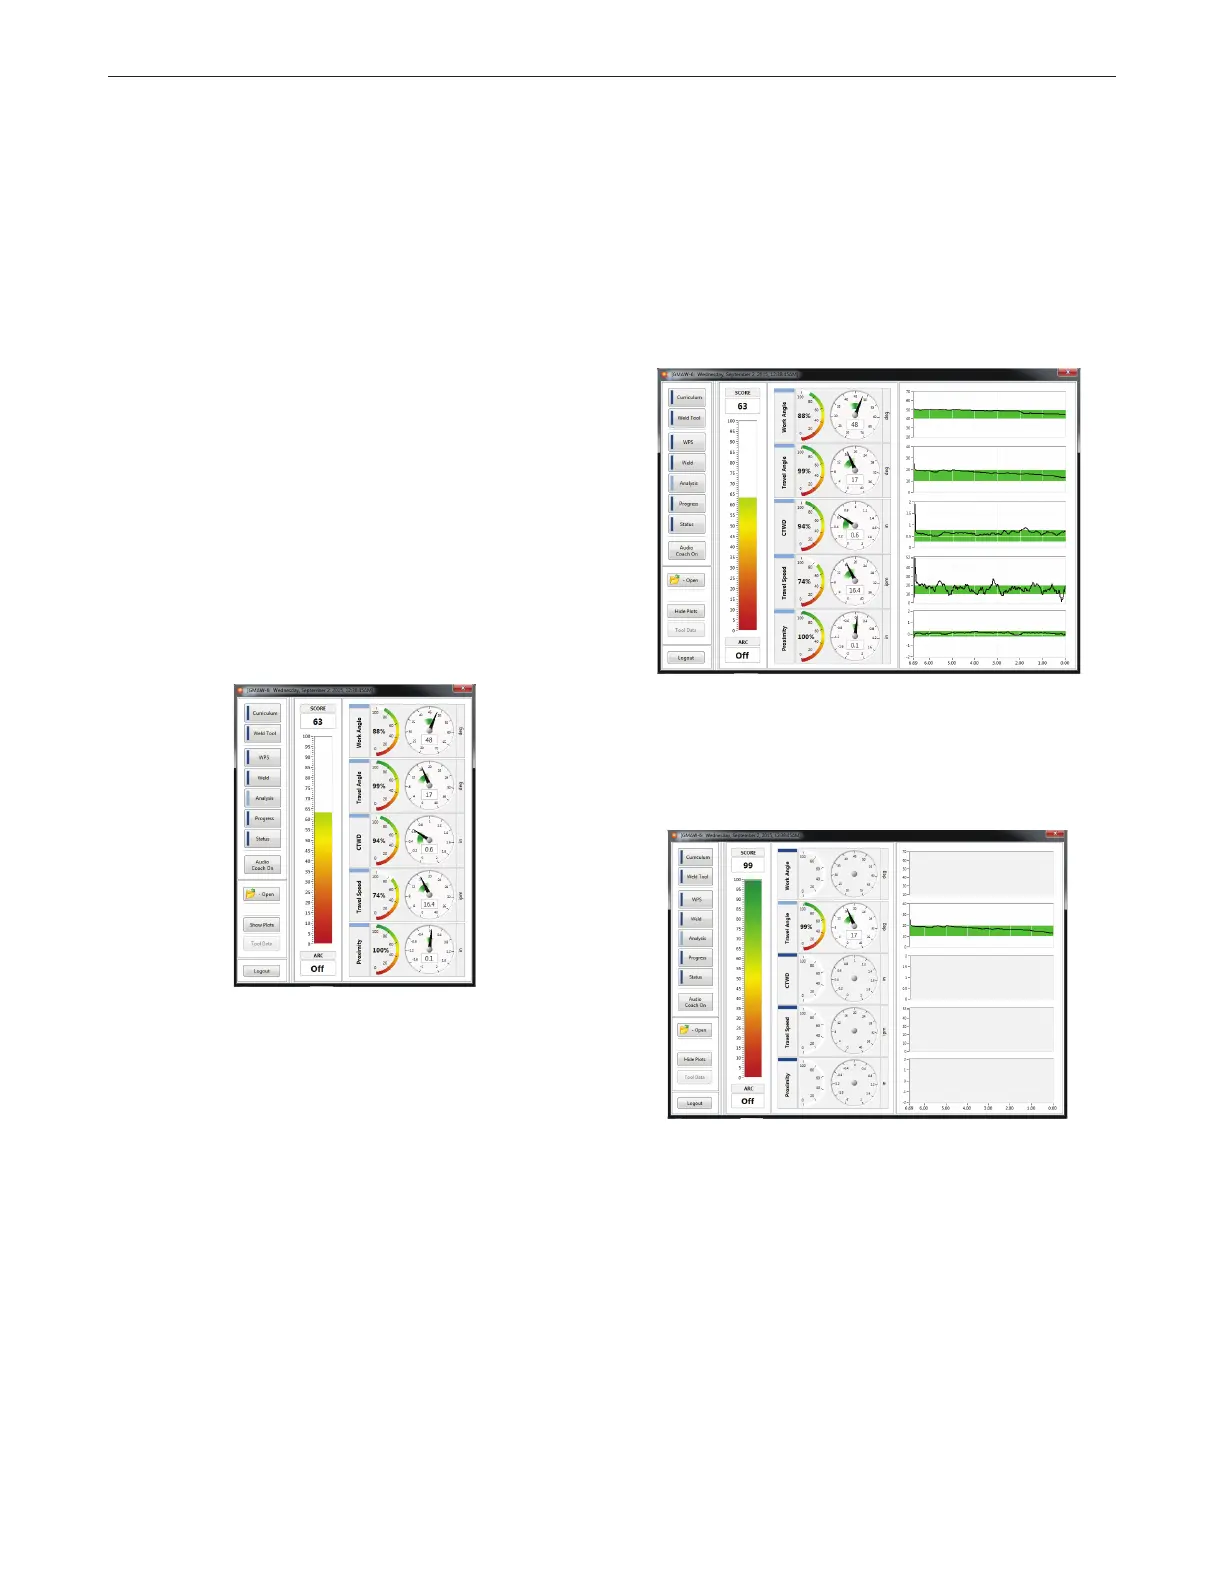
To view a graphical representation of the trainee’s results, select the
‘Show Plots’ icon on the left side of the screen. This will display five
different plots corresponding to each torch motion. The green shaded
area on the plot represents the sweet spot and the goal for the trainee
is to produce results that stay within this area for the entire weld. The
black line represents the values that the trainee actually produced.
In the following example, the trainee was within the sweet spot for
Proximity for most of the weld, but had some areas where the Travel
Speed was not within the sweet spot. These plots help the trainee
understand what areas they need to focus on. See Figure B.86.
Each torch motion can also be displayed independently. This is a
helpful feature if the trainee only wants to work on one torch motion.
Select the torch motions the trainee does not want to see and they
will no longer be displayed on the screen. See Figure B.87.
Figure B.85 – Analysis
Figure B.86 – Analysis graph
Figure B.87 – Independent torch motion graph
Bekijk gratis de handleiding van Lincoln Electric RealWeld, stel vragen en lees de antwoorden op veelvoorkomende problemen, of gebruik onze assistent om sneller informatie in de handleiding te vinden of uitleg te krijgen over specifieke functies.
Productinformatie
| Merk | Lincoln Electric |
| Model | RealWeld |
| Categorie | Niet gecategoriseerd |
| Taal | Nederlands |
| Grootte | 13902 MB |


