Furuno CI-68 handleiding
Handleiding
Je bekijkt pagina 29 van 67
2. INTERPRETING THE DISPLAYS
2-7
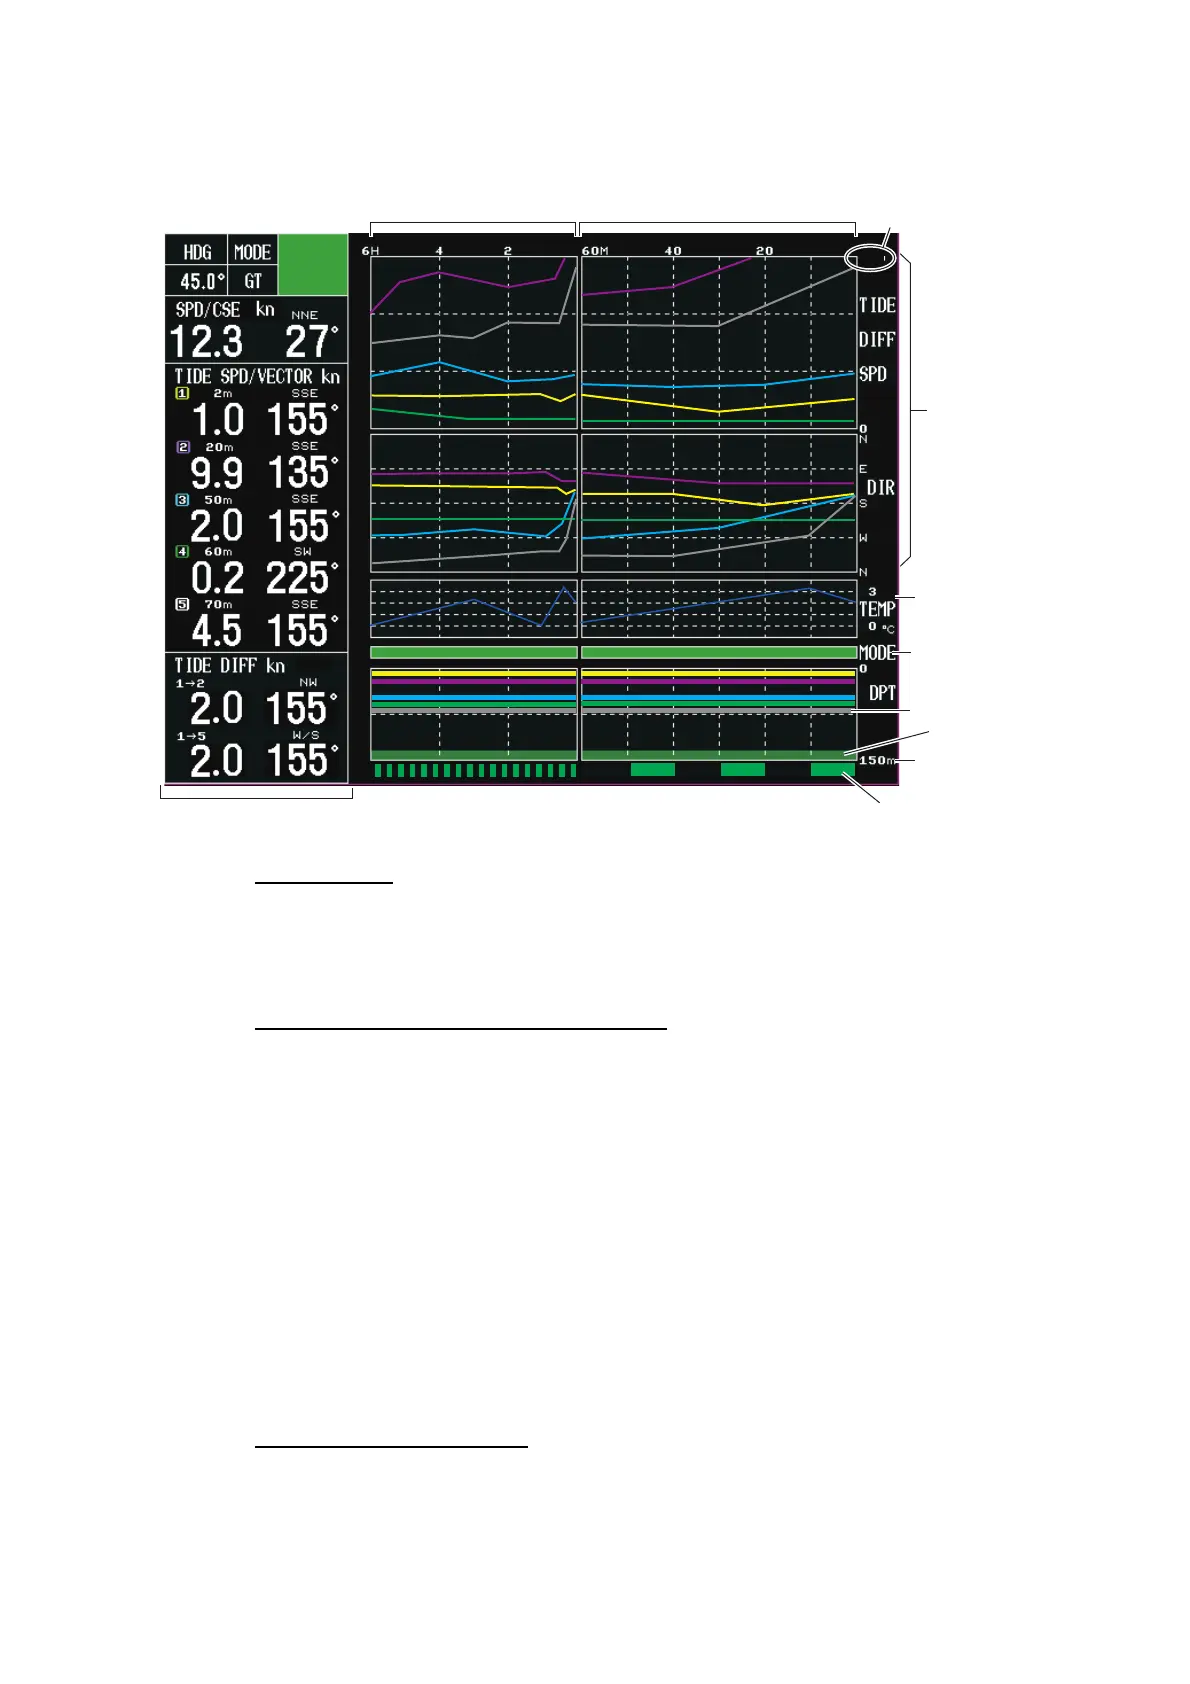
2.3 Graph Display
Text window
The contents are same as ones for the tide vector display, see section 2.1. The text
window may be turned on or off with [TEXT WINDOW] in the [DISP 2] sub menu.
When the text window is turned off, 12 hours of graph data are shown.
Tide (or tide differential, speed) graph
The two graphs (speed and direction) are shown. You may choose the target data to
display as graph among tide, tide differential and ship, see "MODE" on page 3-7.
For a tide graph, the five lines for each layer are shown in the each color; Layer1: Yel-
low, Layer 2: Purple, Layer 3: Blue, Layer 4: Green, Layer 5: Grey. For a tide differen-
tial graph, the two lines of the reference layers are shown. For example, when the
reference layers are Layer 4 and Layer 5, the line colors are green and grey.
The maximum range for the speed (upper graph) is set with [TIDE RANGE] in the
[DISP 1] sub menu. The display style for the direction (lower graph) is set with [TIDE
GRAPH] in the [DISP 2] sub menu.
Note: The color for Layer is black when the setting for [BACKGROUND CLR] is white,
See "BACKGROUND CLR" on page 3-5.
Water temperature graph
The scale of the water temperature graph is 5 °C width. You can hide this graph, see
"TEMP GRAPH" on page 3-8.
Tide Graph (or
Tide Diff or Ship
Speed)
Water Temp.
Graph*
Mode Marker
Depth Graph
Trip Distance Marker
Text Window
Bottom
Depth Range
Max. range of Tide
speed ( or course)
0 - 60 minutes of latest data
0 - 6 hours of latest data
*: Sensor required.
Note: When overlapping occurs, layer having highest
number has priority.
3.0
Bekijk gratis de handleiding van Furuno CI-68, stel vragen en lees de antwoorden op veelvoorkomende problemen, of gebruik onze assistent om sneller informatie in de handleiding te vinden of uitleg te krijgen over specifieke functies.
Productinformatie
| Merk | Furuno |
| Model | CI-68 |
| Categorie | Niet gecategoriseerd |
| Taal | Nederlands |
| Grootte | 6831 MB |


