PreSonus UC Surface handleiding
Handleiding
Je bekijkt pagina 22 van 75
19
4 Graphic EQ
4.1 Enabling Smaart Analysis (StudioLive AI-series only)
UC Surface
Reference Manual
4.1 Enabling Smaart Analysis (StudioLive AI-series only)
Both the GEQ and Fat Channel EQ provide Smaart Spectra™ analysis
when connected to a StudioLive AI-series mixer. Smaart Spectra
was developed by Rational Acoustics to power Smaart’s Spectrum
Measurement Engines and includes an RTA and a spectrograph.
By default, Smaart® analysis is disabled. While Smaart is disabled, you have control
over which bus is routed to the second to last pair of auxiliary FireWire inputs.
Clicking on the Spectrograph or RTA buttons will start Smaart, and UC
Surface will take control over these FireWire auxiliary inputs.
For more information on the Auxiliary Inputs Router, please see Section 8.3.
Note: Smaart analysis requires use of the StudioLive AI-series’ onboard audio
interface. It is not available without a FireWire or FireWire-to-Thunderbolt
connection between your mixer and your computer. UC Surface’s integrated
Smaart modules do not support StudioLive Series III consoles.
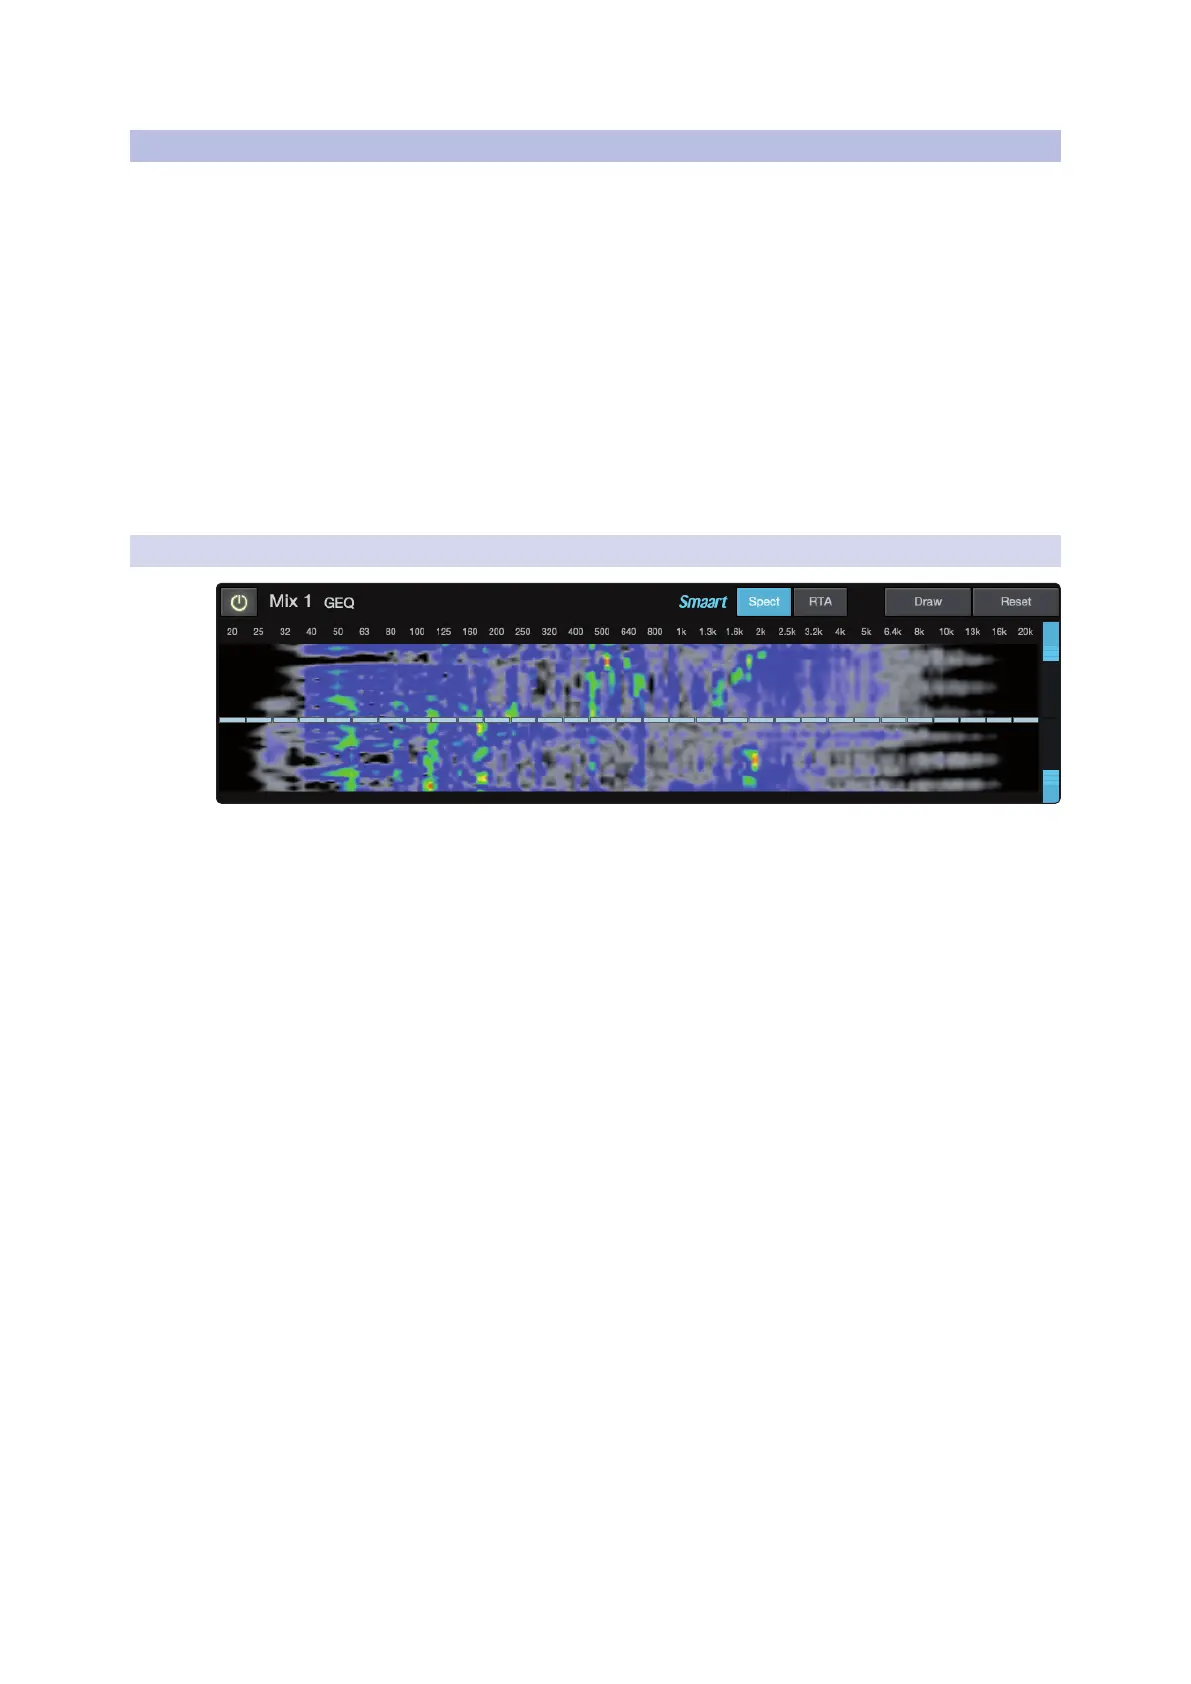
4.1.1 Time-Frequency Spectrograph
Clicking on the Spectrograph button (from the Fat Channel EQ
or GEQ tab) will launch the Time-Frequency Spectrograph. This
spectrograph provides a three-dimensional view of your audio in
which x = frequency, y = time, and color = decibel level.
Any signal below the lower dynamic-range threshold is black. Any signal above
the top dynamic-range threshold is white. Within the dynamic range, colors go
from blue to green to red, with blue indicating the quietest and red the loudest.
Many audio signals that are encountered in the eld are highly dynamic. Musical
signals, speech, and even environmental noise contain signicant changes in spectral
content as a function of time. The spectrograph can be thought of as a record of
multiple RTA measurements taken over time, with color representing amplitude.
Using this function, the spectral content of the input signal is recorded as it changes
in time. This allows you to view and analyze time-varying trends in the input signal.
As a troubleshooting tool, the spectrograph is useful for nding spectral “defects”
in a system or acoustical environment. Certain audio signals or acoustical events
contain specic traits that can be easily detected due to their distinct time/
frequency signature—specically, highly tonal sounds such as AC line noise
in an electrical signal chain or the presence of electro-acoustical feedback.
Dynamic Range
UC Surface provides dynamic-range sliders that set the maximum
and minimum volume thresholds for the spectrograph.
Bekijk gratis de handleiding van PreSonus UC Surface, stel vragen en lees de antwoorden op veelvoorkomende problemen, of gebruik onze assistent om sneller informatie in de handleiding te vinden of uitleg te krijgen over specifieke functies.
Productinformatie
| Merk | PreSonus |
| Model | UC Surface |
| Categorie | Niet gecategoriseerd |
| Taal | Nederlands |
| Grootte | 14432 MB |


