USL LSS-100P handleiding
Handleiding
Je bekijkt pagina 15 van 32
LSS−100P Installation & Operation Manual
v160318 15
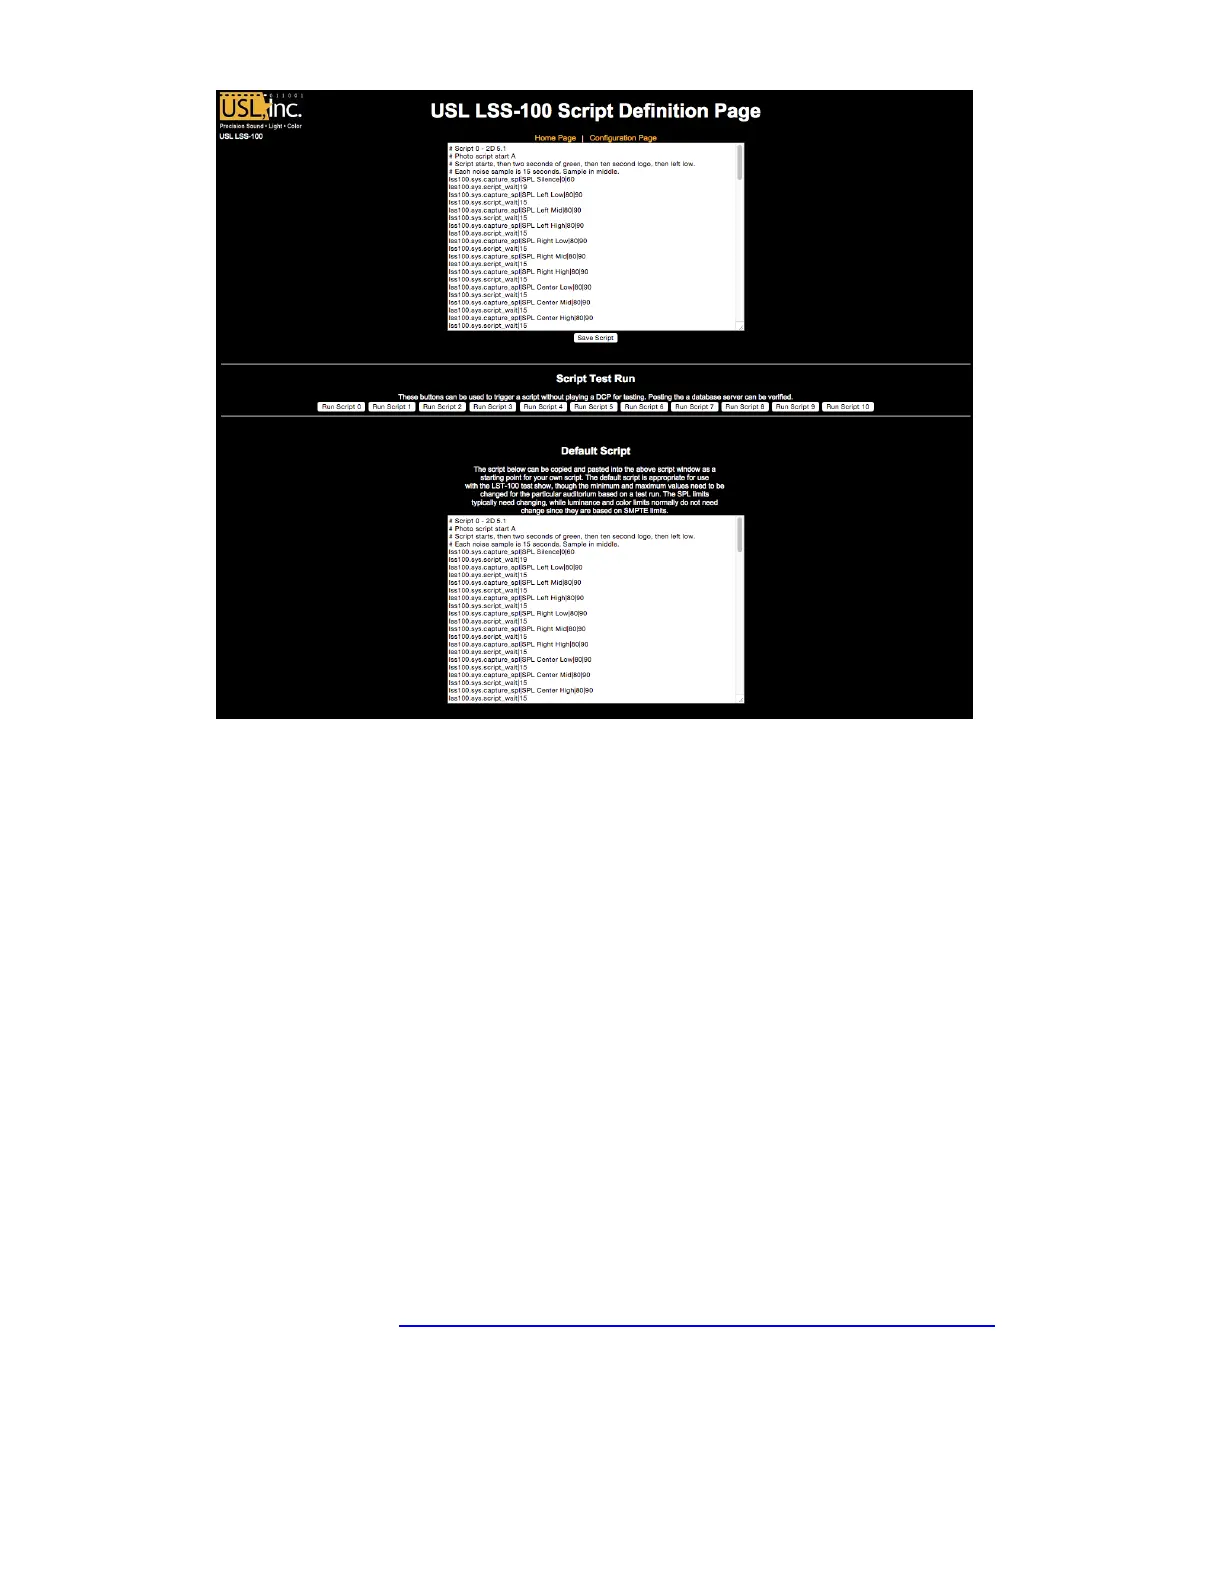
Figure 11 - LSS-100P Command Script Page
9. Click the “Save Script” button to save the revised script.
10. Run the test show a couple times and review the log. It should appear similar to figure 2 but
with the latest values not in red. Measured values that are not between the specified minimum
and maximum are shown in red.
11. Click on a value in the log. A graph of the measured values (similar to figure 3 but with fewer
values) should appear. If the test script has only run once, no graph will appear. At least two
measurements are required to draw the graph.
Script Test Run
The script test run buttons located on the Command Script Definition page allow the user to manually
trigger LSS-100P Command Scripts without having to run the corresponding DCP show normally used.
This may be useful when testing the “post to server” commands.
Data Analysis
The LSS-100P presents the captured data in a log (as shown in figure 2) and a graph (as shown in figure
3). Out of limit operation is easily identified in the log by a value being printed in red. The graphs show
the measured values along with limit lines allowing easy detection of trends and out of limit operation.
Ethernet Device Discoverer (http://ftp.uslinc.com/?dir=ftp/Products/EthernetDeviceDiscoverer ) can
also be used to show out of tolerance operation within a theater.
Log data is also available as a Comma Separated Value file for analysis in a spreadsheet. Click the CSV
link at the bottom of a log page to get the CSV log.
Bekijk gratis de handleiding van USL LSS-100P, stel vragen en lees de antwoorden op veelvoorkomende problemen, of gebruik onze assistent om sneller informatie in de handleiding te vinden of uitleg te krijgen over specifieke functies.
Productinformatie
| Merk | USL |
| Model | LSS-100P |
| Categorie | Niet gecategoriseerd |
| Taal | Nederlands |
| Grootte | 6311 MB |


