Phonic PAA6 handleiding
Handleiding
Je bekijkt pagina 31 van 116
27
PAA6
English
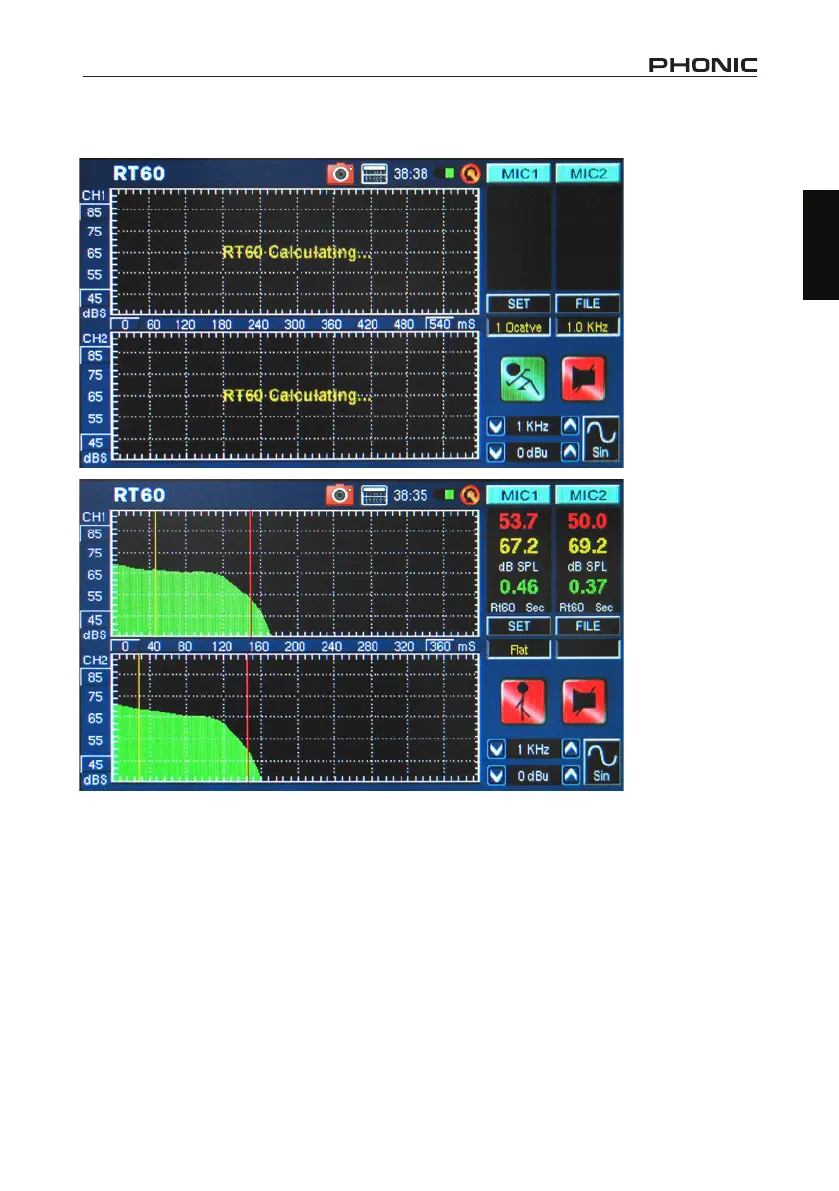
7. After the measurement is taken, the RT60 measurement graph will appear onscreen (gure 40,
and 41).
8. Moving the red and yellow vertical lines on the RT60 graph will allow you to rene your RT60 results.
Position one of these lines at the beginning of the decay slope and the other at the bottom to get an
accurate read-out of the RT60 time. These results can be found to the right of the RT60 graph.
figure 40
figure 41
Bekijk gratis de handleiding van Phonic PAA6, stel vragen en lees de antwoorden op veelvoorkomende problemen, of gebruik onze assistent om sneller informatie in de handleiding te vinden of uitleg te krijgen over specifieke functies.
Productinformatie
| Merk | Phonic |
| Model | PAA6 |
| Categorie | Niet gecategoriseerd |
| Taal | Nederlands |
| Grootte | 63483 MB |


