Cambium Networks cnReach N500 handleiding
Handleiding
Je bekijkt pagina 109 van 253
cnReach N500 User Guide System Configuration
phn-4980_001v004 August 2019)
2-76
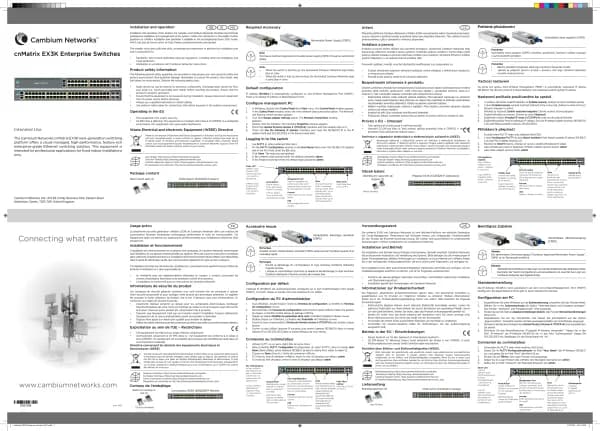
Waterfall View
The waterfall view is in the lower right. This view shows the most recent result at the top and then a
historical view descending towards the bottom of the screen. The x-axis is the same frequencies as
shown in the RSSI view. The Y-axis is time with the most recent result at the top and approximately 5
minutes ago at the bottom (depending on the settings of range, dwell and step size). The color code
shows higher signals as Red and lower signals as Blue.
This particular scan below shows 5 licensed band signals being seen by the analyzer. The frequency in
all red is the highest continuous signal and the three yellow bars are lower levels. There is also an
intermittent red signal that is showing a periodic presence. Possibly due to a SCADA system doing a
periodic poll.
Bekijk gratis de handleiding van Cambium Networks cnReach N500, stel vragen en lees de antwoorden op veelvoorkomende problemen, of gebruik onze assistent om sneller informatie in de handleiding te vinden of uitleg te krijgen over specifieke functies.
Productinformatie
| Merk | Cambium Networks |
| Model | cnReach N500 |
| Categorie | Niet gecategoriseerd |
| Taal | Nederlands |
| Grootte | 43613 MB |